
The metrics that matter most are time-to-fill, time-to-hire, cost-per-hire, vacancy rate, offer acceptance rate, source of hire, funnel conversion rates, and quality of hire. Together, these measure four things: how fast we hire, how well we source, whether candidates are a good fit, and whether new hires stay. Track all eight, and gaps in speed, sourcing, or retention show up early.
TL;DR:
- Compare hire time with fill time: a long vacancy after quick acceptance suggests delayed sourcing; a slow hire cycle may reflect credentialing or checks.
- AAPPR’s recent physician recruitment reporting places median time to fill near 118–119 days; set targets by specialty scarcity, budget, and the vacancy’s effect on coverage.
- High nurse volume with low screen to interview conversion points to poor posting fit; low physician volume with strong conversion calls for sourcing changes.
- Log credentialing and background checks as separate stages, standardize recruiter stage definitions, and review applicant and conversion indicators weekly before monthly cost and retention trends.
- Pair hiring speed and cost with 12 month retention and engagement; low first year retention can erase initial savings and restart the search.
Table of Contents
- Core healthcare recruitment metrics: definitions, formulas, and what each shows
- Benchmarks and targets you can use
- How to measure these metrics reliably
- Applying metrics in practice using healthcare-specific tools and playbooks
- How recruitment metrics affect patient care and organizational performance
- Why hire metrics must be paired with retention and downstream outcomes
- Try a healthcare-focused platform to track and improve hiring metrics
- FAQ
- Sources
- Authority links and benchmarking portals used in this guide
Core healthcare recruitment metrics: definitions, formulas, and what each shows
Each metric answers a different question. Mixing them up leads to the wrong fix.
- Time-to-fill: days from requisition approval to accepted offer. Formula: offer acceptance date minus requisition open date. Shows process speed, from job posting to candidate decision.
- Time-to-hire: days from a candidate's first contact (application or sourcing touch) to acceptance. Formula: offer acceptance date minus candidate first-contact date. Shows how fast an individual candidate moves, independent of how long the requisition sat open before sourcing began.
- Cost-per-hire: total recruiting spend divided by number of hires in a period. Includes job board fees, agency fees, recruiter time, and advertising.
- Vacancy rate: open positions divided by total budgeted positions, expressed as a percentage. Flags chronic understaffing in specific departments or specialties.
- Offer acceptance rate: accepted offers divided by total offers extended. A drop usually points to compensation gaps, slow decision cycles, or a weak candidate experience.
- Source of hire: percentage of hires by channel (referral, job board, agency, direct sourcing). Identifies which channels produce actual hires, not just applicants.
- Funnel conversion rates: the percentage of candidates advancing between stages (applied to screened, screened to interviewed, interviewed to offered). Pinpoints where candidates drop out.
- Candidate quality (quality of hire): typically a blend of new-hire performance ratings, manager satisfaction scores, and 12-month retention. Tells us whether speed came at the expense of fit.
Healthcare adds wrinkles that other industries do not deal with. Credentialing and license verification can stall a candidate who is otherwise ready to start, which widens the gap between time-to-hire and time-to-fill. A physician search with a short time-to-hire but a long time-to-fill usually signals that the requisition sat unposted or unsourced for weeks before recruiting began. The reverse, long time-to-hire paired with reasonable time-to-fill, often points to a credentialing or background-check bottleneck rather than a sourcing problem. Separating these two numbers is the fastest way to tell a sourcing issue from a process issue.
Funnel conversion rates deserve the same scrutiny by role type. A nurse requisition with high applicant volume but low screen-to-interview conversion suggests the job posting draws unqualified applicants, while a specialist physician search with the opposite pattern (few applicants, high conversion once screened) suggests a sourcing, not a filtering, problem.
Benchmarks and targets you can use
Benchmarks only help when matched to role type and specialty, since healthcare hiring timelines vary enormously by position.
- Median physician time-to-fill has run near 118 to 119 days in recent reporting from the Association for Advancing Physician and Provider Recruitment, with some specialties taking considerably longer.
- Advanced practice provider searches tend to close faster than physician searches, though both vary by specialty and region, according to the same AAPPR reporting.
- Healthcare roles generally draw fewer applicants per requisition than roles in other industries, which raises the stakes on speed and candidate experience, per the ASHHRA Healthcare Workforce Report.
- APQC's talent acquisition benchmarks track cycle time from requisition approval to offer acceptance and new-hire retention at 12 months as standard comparison points.
Physician time-to-fill medians have held near 118 to 119 days in recent AAPPR data, a reminder that national medians for physician searches run in months, not weeks, according to AAPPR.
Deciding whether to target the median, the top quartile, or a custom internal number depends on specialty scarcity, budget, and how urgently a vacancy affects patient coverage. A hard-to-fill specialty with chronic understaffing may justify a top-quartile goal and added sourcing investment, while a role with steady applicant flow can run closer to the national median without added spend.
How to measure these metrics reliably
Reliable measurement starts with the candidate waterfall: views, applicants, screens, interviews, offers, hires. Track the conversion rate between each stage, not just the final hire count, since a healthy hire number can still hide a leaky funnel upstream.
- Pull raw counts from ATS stage fields, tagging each candidate's source at the point of application.
- Use career-site analytics to measure the views-to-applicant conversion, which flags a weak job posting before it affects downstream stages.
- Track referral conversion separately, since referred candidates typically move through screens faster.
- Log credentialing and background-check timelines as their own stage, distinct from interview-to-offer time.
Report lead indicators (applicant volume, screen-to-interview conversion) weekly, and review cost, quality, and funnel trends monthly at the role and department level. Dashboards work best with trend lines over time, role-level buckets by specialty, and a cost summary rolled up by channel.
Pro Tip: Standardize stage definitions across every recruiter before pulling a single report, since inconsistent tagging is the most common cause of double-counted or missing candidates.
Applying metrics in practice using healthcare-specific tools and playbooks
A healthcare-only jobs board with verified clinician profiles improves source-of-hire accuracy because every candidate record ties back to a confirmed credential rather than a self-reported title. That same verification layer strengthens quality-of-hire signals before an interview ever happens. Our passive physician recruiting playbook illustrates how staged outreach to passive candidates shortens time-to-fill and lifts screen-to-interview conversion for specialties where active applicants are scarce. Nurse-specific tactics in our 90-day time-to-fill playbook follow the same logic for high-volume clinical roles.
How recruitment metrics affect patient care and organizational performance
A slow time-to-fill on a clinical role is not just a staffing statistic. Every day a position stays open, existing staff absorb the gap through overtime or reduced patient-facing time, which raises burnout risk and can affect care quality. A high vacancy rate in a single department, tracked over several months, often precedes rising turnover in that same unit, since remaining staff carry the extra load until they leave too.
Cost-per-hire matters here as well. Chasing a lower cost-per-hire by cutting sourcing spend can lengthen time-to-fill, which shifts cost elsewhere into overtime, agency staffing, or locum coverage, often at a higher total price. Quality-of-hire metrics close that loop: a new hire who leaves within the first year erases any speed or cost savings from the original search and forces the organization to run the process again.
Recruitment metrics, read together rather than individually, give leadership a workforce stability signal, not just a hiring-speed signal. A department with fast time-to-fill, strong offer acceptance, and weak 12-month retention is not actually solving its staffing problem. It is just restarting it every year.

Why hire metrics must be paired with retention and downstream outcomes
Fast, cheap hiring that does not hold up after twelve months is not success, it just moves the cost further down the calendar. Pair every recruitment dashboard with turnover and engagement data before presenting it as a win. Recruiters should bring hiring metrics into workforce stability conversations, not treat them as a separate scoreboard.
— David
Try a healthcare-focused platform to track and improve hiring metrics
We built a platform around verified clinician profiles and a healthcare-only job board, so source-of-hire and quality-of-hire data start clean instead of needing cleanup later.
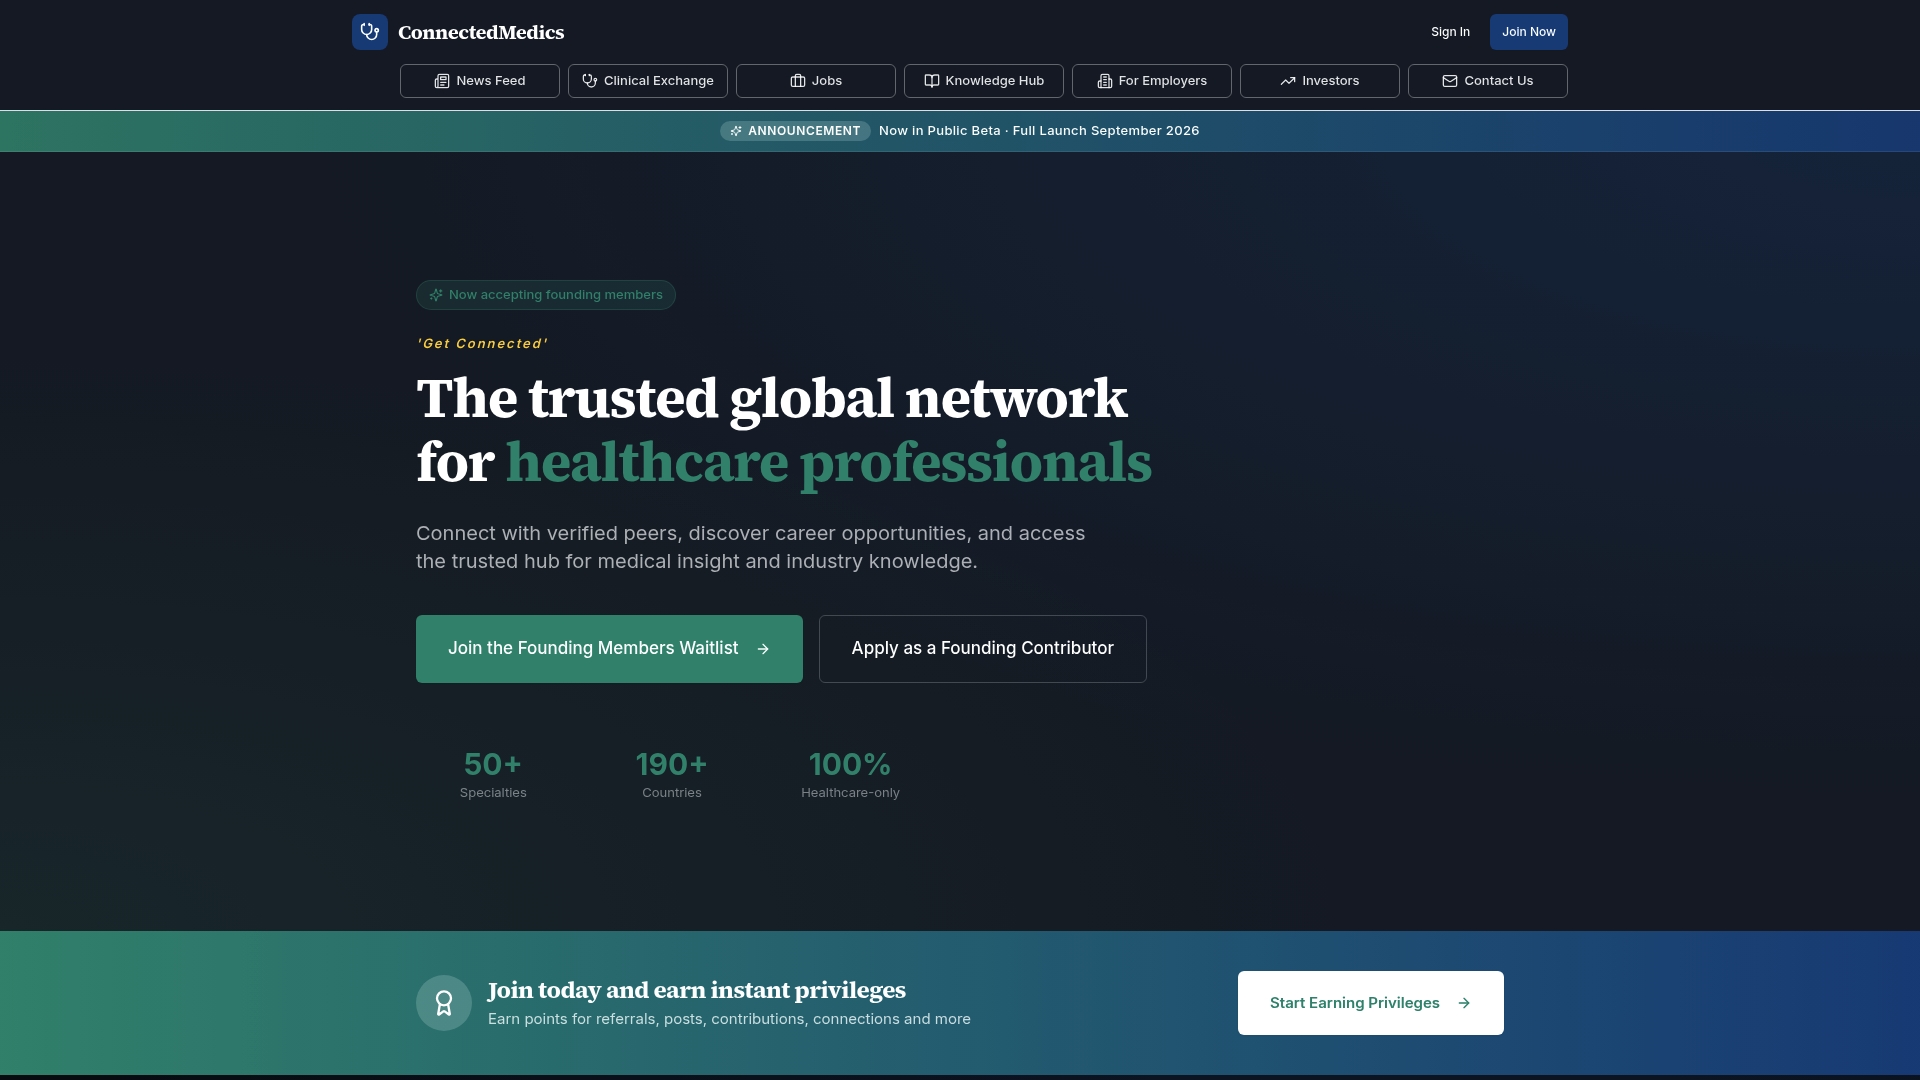
- Post roles to a credential-checked candidate pool instead of a generalist board.
- Compare plan options, including Free and Growth, on our employer plans page.
- Explore Premium Employer features for targeted sourcing on our premium employer page.
FAQ
What are the 5 C's of recruitment?
Definitions vary by organization, but a common version covers candidate experience, cost, compliance, communication, and capability fit. In healthcare recruiting, compliance (licensure and credentialing) and candidate experience carry extra weight given lower applicant volumes per requisition, as noted in the ASHHRA Healthcare Workforce Report.
What are some common metrics used in recruitment?
The most common metrics are time-to-fill, time-to-hire, cost-per-hire, offer acceptance rate, source of hire, and funnel conversion rates between application stages. Quality of hire, often measured through 12-month retention and manager ratings, rounds out the core set according to APQC's benchmarking framework.
What are examples of healthcare performance metrics?
Examples include vacancy rate by department, days-to-fill for physician versus nursing roles, new-hire retention at 12 months, and searches-per-recruiter as a capacity measure. AAPPR's benchmarking guidance also tracks sourcing ROI and candidate waterfall conversion as standard internal measures, detailed in its whitepaper on combining benchmarks with internal data.
What is the 70/30 rule in hiring?
There is no established industry standard ratio in recruitment benchmarking sources, so treat any specific ratio you encounter with caution. If you have seen it applied to screening effort or sourcing mix, check the original source before using it as a benchmark.
Sources
- Physician Recruitment Teams Face Consistent Demand and Lengthy Search Times, According to AAPPR Report - AAPPR
- ASHHRA Healthcare Workforce Report
- Talent acquisition key benchmarks — healthcare industry (APQC)
- BLS: Health care and social assistance: NAICS 62
Authority links and benchmarking portals used in this guide
For raw benchmark data, see AAPPR's physician recruitment reporting, the ASHHRA Healthcare Workforce Report, APQC's talent acquisition benchmarks, and the BLS healthcare industry overview. Nursing-specific workforce trends appear in nursing workforce statistics from our partner resource.