
Physician pay nationally rose roughly 3% to 4.3% in 2026, with radiology, anesthesiology, and pathology leading median gains near 5.7% while primary care lagged around 3.7%. The bigger shift is structural: signing and retention bonuses climbed close to 12% year over year, far outpacing base salary growth of about 2.9% to 3.7%, and regional purchasing power now separates real winners from nominal ones more than raw metro pay does.
TL;DR:
- Signing bonuses increased approximately 12% year over year, surpassing the modest 2.9% to 3.7% growth in base salaries, shifting most compensation gains into incentives.
- Radiology, anesthesiology, and pathology experienced median pay growth of about 5.7%, driven by high demand for imaging, anesthesia, and diagnostics.
- Cost-of-living adjustments reveal that lower-cost regions can offer better real income than high-cost coastal metros, given differences in housing, taxes, and lifestyle expenses.
- Contract clauses such as non-compete scopes, bonus clawbacks, and wRVU thresholds significantly influence physicians' actual earnings and should be scrutinized before signing.
- Compensation trends are influenced by policy shifts, workforce shortages, and inflation, with bonuses and incentives likely to remain key elements in physician pay structures into 2027.
Table of Contents
- National Snapshot: The Real 2026 Physician Salary Numbers
- Compensation by Specialty: Who's Earning the Most in 2026
- Regional Pay Gaps: Raw Salary vs. Real Purchasing Power
- Contract Trends: Bonuses, wRVUs, and the Fine Print That Matters Most
- What to Watch Next: Policy, Reimbursement, and Workforce Signals
- Turning Compensation Data Into Career Decisions
- Emerging and Cooling Specialties Heading Into 2026
- How Employment Model Shapes Physician Pay
- Gender and Diversity Pay Gaps Persist in 2026
- How U.S. Physician Pay Compares Internationally
- What the 2026 Numbers Actually Mean for Your Next Move
- Let ConnectedMedics Put These Numbers to Work for You
- Sources
- FAQ
National Snapshot: The Real 2026 Physician Salary Numbers
Two different data traditions are shaping this year's compensation headlines, and they don't always agree. Survey-based reports from AMGA, Medscape, and MGMA ask physicians and medical groups to self-report pay, capturing perception and broad specialty context across large samples. Contract-based datasets like Resolve pull directly from signed employment agreements, which tends to produce harder, less flattering numbers because they reflect what actually got put on paper rather than what respondents recall or round up.
The AMGA 2026 Medical Group Compensation and Productivity Survey found median total compensation rose about 4.3% overall, with primary care up roughly 3.7%, medical specialties up 4.3%, surgical specialties up 3.2%, and the radiology, anesthesiology, and pathology group leading at close to 5.7%. Medscape's 2026 report, drawing on physician-reported pay for 2025, found a more modest average increase near 3%, a gap that's common when self-reported averages get pulled down by part-time and early-career respondents that survey samples capture more heavily than contract databases do.
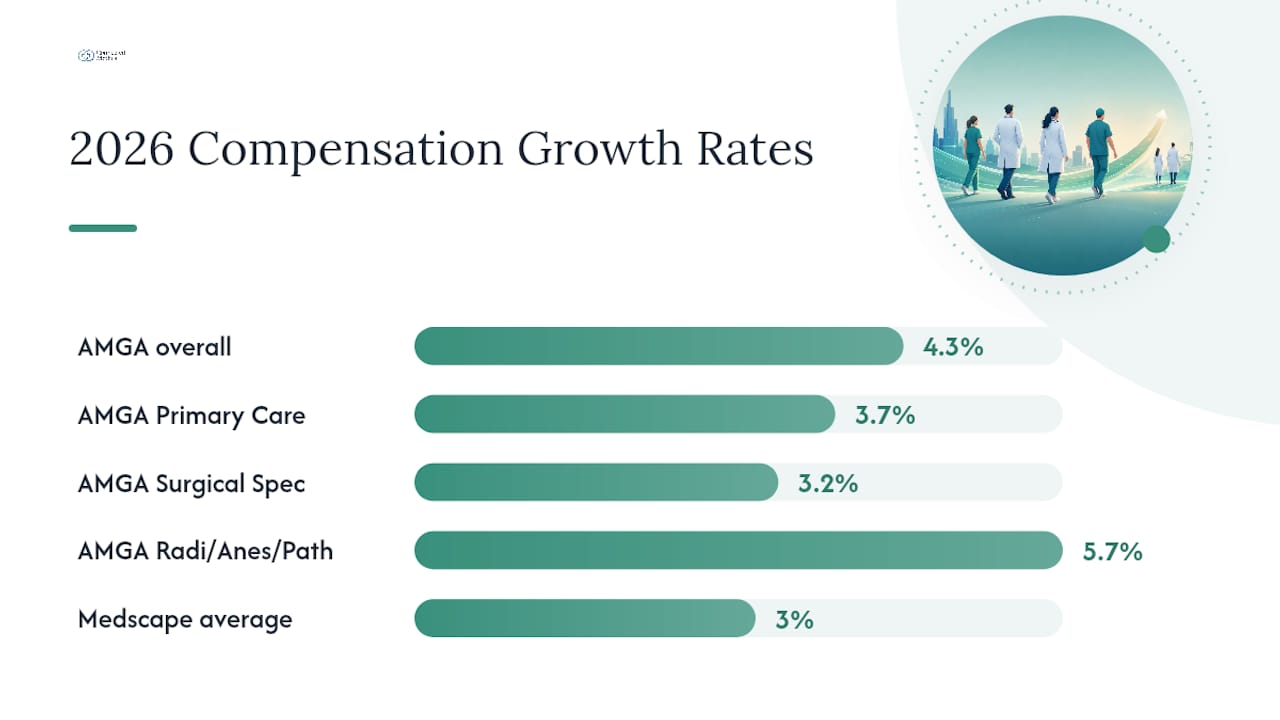
Resolve's contract dataset tells the more revealing story. Analyzing thousands of signed physician contracts, it found an average base salary near $387,000 for the 2025 to 2026 cycle, with a median signing bonus around $25,000. Base pay itself grew a modest 2.9% to 3.7%, but signing bonus value jumped roughly 12%, a far faster clip. That gap is the single most important number in this year's data: employers are increasingly buying flexibility by paying more up front and in incentives rather than locking in higher permanent base pay.
A few figures anchor the rest of this article:
- National median total compensation growth: roughly 3% to 4.3%, depending on survey versus contract source
- Average contract-reported base salary: about $387,000
- Median signing bonus: approximately $25,000, up about 12% year over year
- Base salary growth: 2.9% to 3.7%, trailing bonus growth by a wide margin
Bonus growth of around 12% against base growth under 4% means signing incentives, not salary lines, are where most of this year's real compensation gains are landing.
Sample size matters here too. AMGA's survey draws from a large multi-specialty group base, MGMA's DataDive product pulls from thousands of medical groups nationally, and Resolve's report covers thousands of real employment contracts, which is why contract data tends to catch the bonus shift that pure survey averages sometimes smooth over.
Compensation by Specialty: Who's Earning the Most in 2026
Procedural and surgical specialties still dominate the top of the pay scale, but the fastest median growth in 2026 landed somewhere different. The radiology, anesthesiology, and pathology group posted the strongest median increase of any category tracked by AMGA, at roughly 5.7%, ahead of medical specialties (4.3%) and surgical specialties (3.2%). Demand for imaging throughput, anesthesia coverage, and diagnostic pathology capacity appears to be outrunning supply faster than in other categories this cycle.
| Specialty group | 2026 median compensation growth | Compensation composition |
|---|---|---|
| Radiology, anesthesiology, pathology | ~5.7% | Heavy productivity/wRVU weighting, call pay |
| Medical specialties (cardiology, GI, etc.) | ~4.3% | Mixed base plus incentive |
| Primary care | ~3.7% | Base-heavy, with quality bonuses |
| Surgical specialties | ~3.2% | Base plus case volume incentives |
These are median figures, and medians hide enormous internal spread. A cardiologist's total compensation in the 25th percentile of their specialty can sit tens of thousands of dollars below the 75th percentile, driven by call burden, procedural mix, group size, and geography. That spread is exactly why a single "average physician salary" headline is close to useless for evaluating a specific offer.
Compensation composition also differs by category in ways that change how much of your pay is actually guaranteed. Cognitive specialties like primary care and many medical subspecialties lean more heavily on base salary with wRVU-linked adjustments layered on top. Procedural and surgical specialties tend to carry a higher share of total pay in productivity bonuses and case-volume incentives, meaning a slow quarter in the operating room can hit take-home pay harder than a slow quarter hits an internal medicine base salary.
A few practical patterns for evaluating where an offer sits in the distribution:
- Ask for the comp/wRVU ratio the employer is using, not just the base number.
- Request the group's or region's percentile data if the employer references benchmarking data at all.
- Compare signing bonus structure separately from base. A large bonus can mask a below-median base salary.
- Factor in call frequency and coverage requirements, which are rarely reflected in the headline salary figure.
If a recruiter quotes a number without specifying whether it's base only, base plus bonus, or total cash compensation including productivity incentives, that's a request worth making before comparing it to any survey median.
Regional Pay Gaps: Raw Salary vs. Real Purchasing Power
Raw compensation numbers by metro area tell one story. Cost-of-living-adjusted pay tells a different, often more useful one. A physician earning a higher nominal salary in a coastal metro can end up with less real spending power than a colleague earning less on paper in a lower-cost region, once housing, state income tax, and local prices are factored in.
BEA state-level data on real personal income and consumption expenditures shows how widely purchasing power can diverge between states even when nominal income looks similar. A cardiologist earning $420,000 in a high cost-of-living metro on one coast may retain meaningfully less real income than a cardiologist earning $370,000 in a Midwest or Southern metro with lower housing costs and no state income tax.
Three mechanisms drive that gap:
- State and local taxes. States with no income tax can add the equivalent of tens of thousands of dollars in real annual value compared to high-tax states, even at identical nominal pay.
- Housing costs. A mortgage payment or rent that consumes 40% of income in one metro might consume 15% in another for a comparable property.
- On-call burden and coverage density. Rural and underserved metros often pay more precisely because fewer physicians are available to share call, which is compensation for lifestyle cost, not just cash.
Pro Tip: Before comparing two job offers by salary alone, run both through a basic cost-of-living calculator and subtract state income tax. A $30,000 gap in nominal salary can vanish, or reverse, once housing and taxes are accounted for.
Employers use this same logic when setting pay. Hospital systems in expensive coastal markets often benchmark against local competitors rather than national medians, while rural and underserved systems lean on signing bonuses and loan repayment to offset the lifestyle trade-offs that raw salary numbers can't fully capture.
Contract Trends: Bonuses, wRVUs, and the Fine Print That Matters Most
The defining structural trend of 2026 is the widening gap between bonus growth and base growth. Resolve's contract data shows signing and retention incentives rising close to 12%, while base pay crept up only 2.9% to 3.7%. Employers are increasingly using cash incentives to compete for talent without permanently raising fixed labor costs, a trend that shifts negotiating leverage toward whoever reads the contract fine print most carefully.
wRVU-based productivity pay is also tightening. Many groups are recalibrating comp per wRVU ratios and raising the productivity thresholds required to hit bonus tiers, meaning physicians increasingly need to generate more relative value units to reach the same bonus level they might have hit a year or two earlier.
Contract clauses that carry outsized long-term impact:
- Non-compete scope and duration. Even where enforceability varies by state, a broad non-compete can limit your next job search within your own metro for a year or more.
- Signing bonus clawback terms. Many bonuses require repayment if you leave before a set tenure, often two to three years.
- wRVU threshold and comp/wRVU ratio. This determines exactly how much extra productivity translates into extra pay, and thresholds have been rising.
- Call pay and coverage requirements. Unpaid or underpaid call obligations quietly erode effective hourly compensation.
- Incentive eligibility timing. Some bonuses vest only after a full contract year, affecting first-year cash flow.
Before signing anything, ask what the group's average wRVU production looks like at your specialty and experience level, whether the signing bonus is subject to clawback, and how call pay is structured separately from base. Those three questions surface more real information than the headline salary number ever will.
What to Watch Next: Policy, Reimbursement, and Workforce Signals
Several signals could shift compensation trajectories into 2027. The CMS 2026 Physician Fee Schedule final rule adjusts Medicare payment policy in ways that ripple through employer budgets for months after publication. Separately, Health Affairs has raised the question of whether AI tools will eventually reshape reimbursement for cognitive, nonprocedural services, a debate still unresolved but worth tracking closely.
- HRSA workforce projections point to continued supply gaps in several specialties and regions, sustaining upward pay pressure where shortages persist.
- CPI data from the BLS matters because nominal raises near 3% to 4% only translate into real gains if inflation stays below that range.
- Watch for continued divergence between bonus-heavy and base-heavy compensation models as employers respond to margin pressure differently by specialty.
Turning Compensation Data Into Career Decisions
Benchmarking an offer well means triangulating survey medians with contract-level reality, not picking one number and trusting it. Combine AMGA or MGMA specialty medians with Resolve's contract-based base and bonus figures to see both the broad trend and what's actually landing on signed paper.
- Physicians evaluating an offer: compare the base against contract-data medians, then separately evaluate bonus structure and clawback terms.
- Hiring managers: benchmark against both survey and contract sources to avoid underpricing a role relative to what competitors are actually signing.
- Use a salary trends resource alongside a job board that lets you filter by specialty and region before comparing offers side by side.
Emerging and Cooling Specialties Heading Into 2026
Demand isn't flat across the specialty map, and 2026's compensation data hints at where that's heading next. Radiology, anesthesiology, and pathology posted the strongest median growth this cycle, and workforce projections from HRSA suggest continued supply pressure in several of these diagnostic and hospital-based fields, which tends to keep compensation growth elevated as long as the gap between training pipeline output and clinical demand persists.
Primary care remains a mixed picture. Base compensation growth trails other categories at around 3.7%, yet persistent shortages in underserved and rural regions keep signing bonuses and loan repayment incentives unusually generous relative to base pay, a pattern that likely continues as value-based care models expand quality bonuses on top of flat base structures.
Specialties tied closely to elective, discretionary procedures face more uncertainty. When consumer spending tightens or reimbursement scrutiny increases for elective volume, compensation growth in those areas tends to flatten faster than in specialties tied to unavoidable acute or diagnostic care. Meanwhile, fields intersecting with digital health and remote monitoring, including telepsychiatry and virtual primary care, are seeing employers experiment with hybrid compensation models that blend traditional wRVU credit with flat telehealth session rates, an adjustment still being standardized across the industry heading into 2027.
How Employment Model Shapes Physician Pay
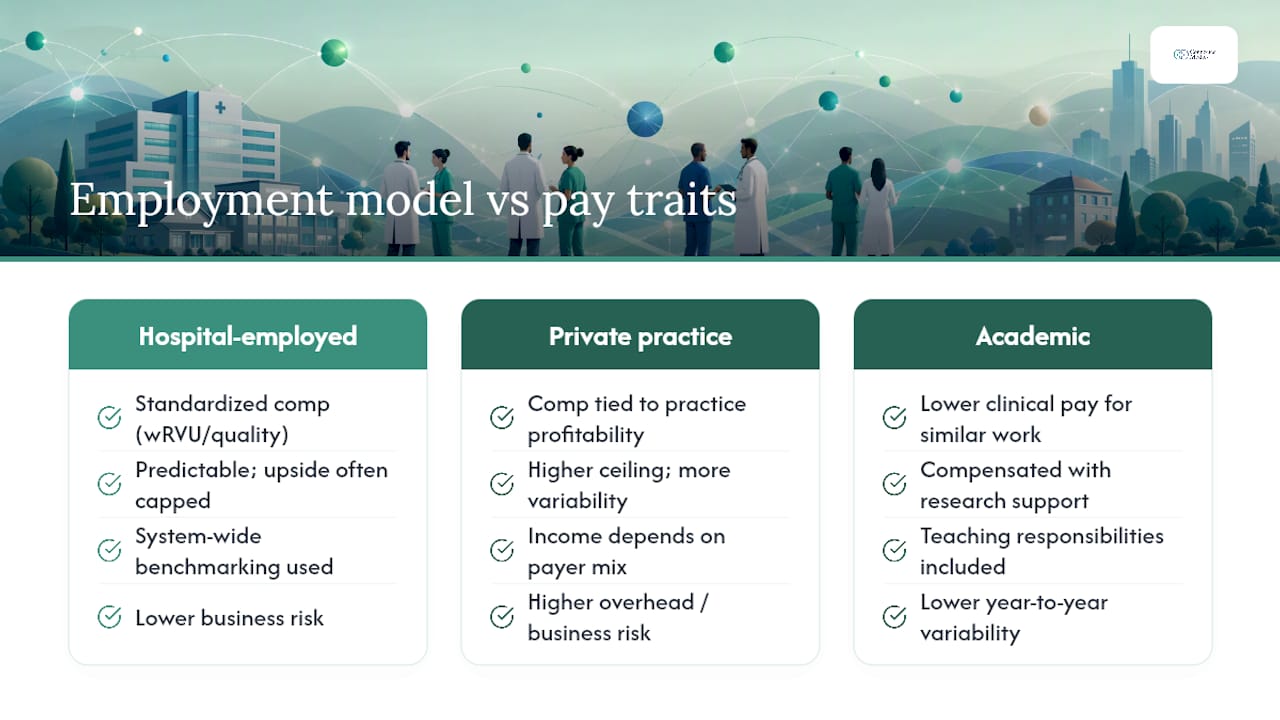
Where you work matters almost as much as what you practice. Hospital-employed physicians, who now make up the majority of the U.S. physician workforce, typically see more standardized compensation structures tied to wRVU production, quality metrics, and system-wide benchmarking, which brings predictability but often caps upside compared to ownership models.
Private practice physicians, particularly partners in specialty groups, retain more direct exposure to practice profitability and productivity, which can mean higher ceiling compensation but also more year-to-year variability tied to payer mix, overhead costs, and local competition. Independent practices in high-demand procedural specialties can outearn hospital-employed peers substantially, though they also absorb more business risk.
Academic medicine sits at a different point on the spectrum entirely. Compensation typically runs lower than private practice or even hospital employment for comparable clinical work, offset by research support, teaching responsibilities, and often better work-life structure. Academic centers also tend to move slower on compensation adjustments, meaning the bonus-driven gains showing up in community and hospital-employed contracts this year are less pronounced in university-affiliated systems. For physicians choosing between models, the trade-off isn't just about the number on the offer letter. It's about how much of that number is guaranteed versus tied to productivity you don't fully control.
Gender and Diversity Pay Gaps Persist in 2026
Compensation gaps by gender remain one of the most stubborn features of physician pay, and 2026 data hasn't closed that gap. Medscape's 2026 report again documented a measurable gap between male and female physician compensation, consistent with the pattern the survey has tracked for years across specialties.
Part of the gap reflects specialty distribution, since fields with historically higher male representation, including several surgical subspecialties, also carry higher average pay. But Medscape's data shows the gap persists even within the same specialty, pointing to negotiation dynamics, part-time and flexible-schedule prevalence, and unequal access to productivity-boosting opportunities like additional call coverage or leadership stipends.
Closing that gap matters for more than fairness. Groups and health systems that fail to address it risk losing qualified candidates to competitors actively marketing pay equity as a recruitment advantage, particularly as younger physicians entering the workforce weigh compensation transparency more heavily when comparing offers. Reviewing comp/wRVU ratios by gender within a group, rather than relying on aggregate averages, is one of the more direct ways administrators can identify where internal gaps are hiding.
How U.S. Physician Pay Compares Internationally
U.S. physician compensation remains among the highest in the world in absolute terms, a gap driven largely by the country's reliance on private insurance markets, higher administrative overhead, and a compensation culture that ties pay more directly to procedural volume than most national health systems do. Physicians in countries with single-payer or heavily regulated systems typically earn less in nominal terms, though many also carry lower medical education debt and different tax and benefits structures that change the real comparison.
That gap isn't shrinking in 2026. The bonus-driven growth pattern showing up in the U.S. For U.S. physicians and administrators benchmarking internationally, the more useful comparison isn't raw salary but total career economics: education debt load, tax burden, and malpractice exposure alongside gross pay, since all of those vary as much across countries as compensation itself does.
What the 2026 Numbers Actually Mean for Your Next Move
The headline growth number matters less than where it's coming from. Bonuses rose roughly three times faster than base pay this year, which means the real negotiation now happens in the fine print, not the salary line. If you only compare offers by base salary, you're comparing the wrong number.
— David
Let ConnectedMedics Put These Numbers to Work for You
Compensation data only helps if you can act on it before your next contract lands on the table. ConnectedMedics offers verified physician profiles, a global jobs board with healthcare vacancies filtered by specialty and region, and a knowledge hub containing clinical and workforce research, aiming to help users benchmark offers against market data.

Whether you're a physician deciding if a signing bonus is masking a below-median base, or a hiring manager trying to set a package that won't lose candidates to a competitor's incentive structure, the same data discipline applies: compare specialty medians, check regional purchasing power, and read the contract clauses before the salary line with help from Healthcare SEO Services to increase appointments. The specialty-led community and jobs board enables comparison of current postings by specialty and region against median compensation data.
This article is general information, not a substitute for advice from a qualified financial advisor. Consult a qualified financial professional about your own circumstances before acting on anything here.
Sources
- AMGA 2026 Medical Group Compensation and Productivity Survey (charts)
- 2026 Physician Salary & Employment Report | Resolve
- BLS — Consumer Price Index 2025 in review
FAQ
What Are the Expected Physician Compensation Trends for 2026?
National median compensation growth is running roughly 3% to 4.3%, with radiology, anesthesiology, and pathology leading and signing bonuses growing far faster than base pay, near 12% year over year.
Are Physician Salaries Actually Increasing in 2026?
Yes, but modestly. Base salaries grew about 2.9% to 3.7%, according to Resolve's contract data, while most of the real compensation growth is showing up in signing and retention bonuses rather than permanent base increases.
Is Being a Doctor Still Worth It in 2026?
Compensation growth remains positive and generally outpaces inflation, though the value of any offer now depends heavily on bonus structure, contract clauses, and regional cost of living, not just the headline salary figure.
Is There a Cap on Non-Monetary Compensation for Physicians in 2026?
Non-monetary compensation limits, such as those tied to certain federal and nonprofit hospital arrangements, vary by employer type and specific regulatory program rather than following one universal figure, so physicians should confirm the applicable limit directly with the employer's compliance office.
How Do Regional Differences Affect Physician Pay in 2026?
Raw salary rankings by metro often reverse once cost of living, state income tax, and housing costs are factored in, meaning a lower nominal salary in an affordable region can outperform a higher salary in an expensive one on a purchasing-power basis, per BEA state-level income data.